4.5 out of 5 stars
(21 reviews)
Zabbix
Zabbix is the ultimate enterprise-level software designed for real-time monitoring of millions of metrics collected from tens of thousands of servers, virtual machines
Zabbix is Open Source and comes at no cost.
METRIC COLLECTION
Collect metrics from any devices, systems, applications
Metric collection methods:

PROBLEM DETECTION
Define smart thresholds
Detect problem states within the incoming metric flow automatically. No need to peer at incoming metrics continuously.
- Highly flexible definition options
- Separate problem conditions and resolution conditions
- Multiple severity levels
- Root cause analysis
- Anomaly detection
- Trend prediction

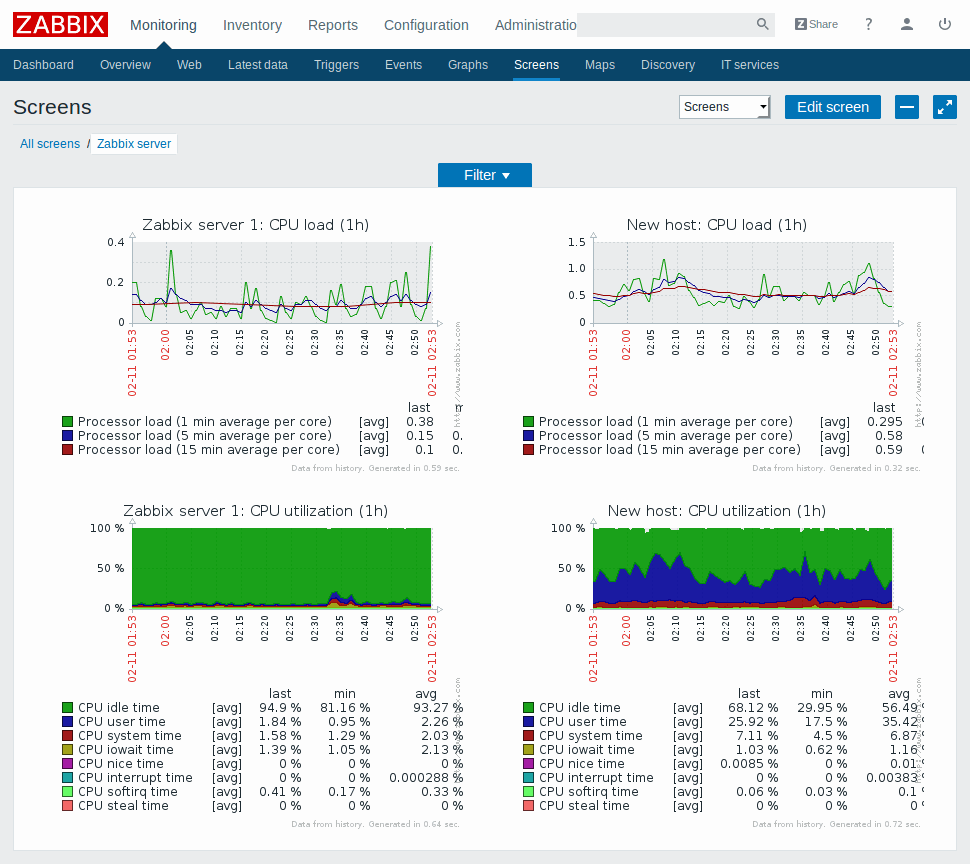
VISUALIZATION
Single pane of glass
The native web interface provides multiple ways of presenting a visual overview of your IT environment:
- Widget-based dashboards
- Graphs
- Network maps
- Slideshows
- Drill-down reports

NOTIFICATION AND REMEDIATION
Be notified in case of any issues, guaranteed
Inform responsible persons about occurred events using many different channels and options:
- Send messages
- Let Zabbix fix issues automatically
- Escalate problems according to flexible user-defined Service Levels
- Customize messages based on recipient's role
- Customize messages with runtime and inventory information
Save yourself from thousands of repetitive notifications and focus on root causes of a problem with Zabbix Event correlation mechanism.

SECURITY AND AUTHENTICATION
Protect your data on all levels
- Strong encryption between all Zabbix components
- Multiple authentication methods: Open LDAP, Active Directory
- Flexible user permission schema
- Zabbix code is open for security audits

EFFORTLESS DEPLOYMENT
Save your time by using out-of-the-box templates
- Install Zabbix in minutes
- Use out-of-the-box templates for most
of popular platforms - Build custom templates
- Use hundreds of templates built by Zabbix community
- Apply for Template building service from Zabbix team
- Monitor thousands of similar devices by using configuration templates

AUTO-DISCOVERY
Automate monitoring of large, dynamic environments
Take automatic actions upon adding/removing/changing elements.
- Network discovery: periodically scans
network and discovers device type, IP, status, uptime/downtime, etc, and takespredefined actions. - Low-level discovery: automatically creates items, triggers, and graphs for different elements on a device.
- Auto-registration of active agent: automatically starts monitoring new equipment with Zabbix agent.

DISTRIBUTED MONITORING
Scale without limits
Build
- Collect data from thousands of monitored devices
- Monitor behind the firewall, DMZ
- Collect data even in case of network issues
- Remotely run custom scripts on monitored hosts

ZABBIX API
Integrate Zabbix with any part of your IT environment
Get access to all Zabbix functionality from external applications through Zabbix API:
- Automate Zabbix management via API
- 200+ different methods available
- Create new applications to work with Zabbix
- Integrate Zabbix with
third party software: Configuration management, ticketing systems - Retrieve and manage configuration and historical data

See what users are saying about Zabbix


4.4 out of 5 stars
(21 reviews)
(21 reviews)

4.7 out of 5 stars
(15 reviews)
(15 reviews)

4.5 out of 5 stars
(21 reviews)
(21 reviews)

9.4 out of 10 stars

4.4 out of 5 stars
(55 reviews)
(55 reviews)

4.2 out of 5 stars
(83 reviews)
(83 reviews)

8.5 out of 10 stars
(57 reviews)
(57 reviews)

4.3 out of 5 stars
(20 reviews)
(20 reviews)
4.5 out of 5 stars
(21 reviews)
(21 reviews)